
Between industry, geography and other elements, building a balanced portfolio has always been a focus for private credit investors, but now a new issue is arising: how much exposure they may have to a single investment via multiple funds.
This is the result of the asset class’s evolution: It’s growth from niche to mainstream. With multibillion-dollar deals closing regularly, lender groups are larger, leading to more overlap. The issue has also brought the importance of diversification in view and led investors to consider how they are breaking down their direct lending allocations by market segment.
“There is some correlation in the size of the loan and the number of lenders, so portfolio overlap is more common for BDCs focused on larger companies in the middle market, whereas BDCs focused on smaller companies in the lower middle market will have less portfolio overlap,” said Chelsea Richardson, a senior director in Fitch Ratings’ non-bank financial institutions group.
LFI did an analysis of 162 BDCs to examine overlap between the funds using data from their most recent quarterly reports, as of June 30, which SOLVE put together. While this analysis includes only BDCs, they can often be a proxy for the larger market.
Most direct lenders operate a BDC, and those lenders allocate their investments fairly across all their funds, including drawdown vehicles. As a result, multiple funds operated by the same manager may hold the same paper as the BDC holds.
Further, those private credit managers that don’t operate a BDC often invest in the same or similar deals as managers that do have a BDC. This all allows market observers to arrive at reasonable observations about the larger direct lending ecosystem based on the BDC data.
Based on the SOLVE data on individual BDC overlaps, we excluded overlaps between BDCs with the same ultimate parent. We then divided the universe of BDCs based on their assets by fair value, before calculating average overlaps for each size category.
What emerged from the analysis was a picture of how large funds tend to have more overlap with their peers than smaller BDCs. Those with a fair value portfolio of more than $5bn, across 21 BDCs, had a portfolio overlap of 9.2% among their peer set.
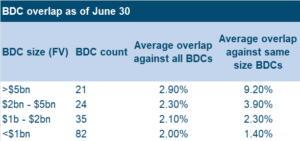
Sources: SEC filings, SOLVE, LFI analysis
That figure declined notably to 3.9% for those 24 BDCs with a fair value portfolio of $2bn to $5bn. Among funds with $1bn to $2bn and those with under $1bn was, that statistic was 2.3% and 1.4%, respectively.
“It makes sense: these BDCs do larger deals and tend to club together. I’m not saying every top-10 [manager] works with every top-10 [manager], but typically one top-10 will have frequent overlap with four or five peers in that cohort,” Sourav Srimal, senior vice president, private credit, at SOLVE said.
“It’s not uncommon now to see a $1bn private deal. Five or six years ago, BDCs and direct lending were mostly middle market. But with bank pullbacks and periods when banks wouldn’t lend to portfolio companies that they deemed risky, many borrowers tapped private credit. Even when the syndicated market was ‘open,’ many issuers preferred private credit because it’s reliably open for business,” he said.
Big deals, big lender syndicates
Larger lender groups can be a preference for sponsors, said Alfred Xue, a partner and global vice chair of the banking and private credit practice at Latham & Watkins.
“In larger deals, sophisticated sponsors are going to want to have more than one lender in the mix if possible; in an ideal situation, they would like to have multiple lenders,” he said. “Private credit lenders are going to want to have the most influence in any given credit if possible; for the right deal, they will want as much of the deal as they can underwrite.”
And the lenders may make a play for the biggest hold-size they can get.
“For attractive credits, some private credit investment committees have a view that they are going to try to get as much as they can. Today, it has become possible for some of the larger players to speak for a $500mn ticket, but even for the largest players, they will not be able to speak for an entire $5bn deal,” he said.
Take the $4.6bn financing supporting Hellman & Friedman’s $10.2bn take-private of Zendesk, which was one of the largest financings at its closing in November 2022. As of June 30, the loan was held across 20 different BDCs, according to the data compiled by SOLVE.
Another example is Catalent, which was issued under an entity titled Creek Parent. The company received a $4.8bn financing to support its acquisition by Novo Nordisk. Ten managers across 23 BDCs hold the loan, per SOLVE data.
It is worth noting that in both cases, these are only the lenders that are publicly disclosed. There could be additional lenders that only hold the paper in a private fund, which are not required to disclose their holdings with the SEC as BDCs are.
The focus on the investment process must be who are the companies that are best to lend to, one large credit manager said. The goal is that proprietary origination channels, among other things, can lead to less overlap among peers.
Investors want to know that a firm differentiates itself; otherwise, it becomes correlated performance, the large credit manager said.
A second credit manager noted that investors likely care more about low fees, a diverse portfolio and good credit selection. That source said that while managers like to claim their unique sourcing abilities, investors likely care more about those other factors.
Sophisticated sponsors also have a say in how the debt is distributed, though, and they may want to have more lenders than fewer, Latham’s Xue said, noting that not every lender will be willing to participate in every deal, even for their closest sponsor relationships.
Working with lenders to allow them into attractive credits may make that lender more willing to work with the sponsor on another deal, he said. This is particularly helpful when a deal “may not be in the credit box” for a particular lender–having broader relationships means sponsors will be able to find willing lenders for a greater range of deals.
“It’s a relationship business; it always has been,” he said.
Diversification is key for LPs
Diversification takes priority when LPs are building out a private credit portfolio, said Jamie Gnall, a senior vice president at investment consultant Wilshire. He noted that the upper middle market and large-cap areas are seeing more overlap because of the significant amount of money needed for those deals.
“Because of that, we would also consider diversification across different segments of target market size–so limiting our exposure to the upper end of that market and the number of managers or allocations to that space,” he said.
What is the magic number for investors when it comes overlap? Well, it’s more of an art than a science.
“We don’t put a hard number on specific overlap figures, but I’d say anytime you have more than 30% overlap across individual portfolios, you’re probably better off looking for more complementary, diversifying exposure rather than just adding to that existing exposure,” Gnall said.
Francis Griffin, a senior vice president and head of private credit research at Callan, cited a lower number, though he emphasized that overlap is not the most important consideration.
“If you see that 10% threshold with multiple parties, it’s a more meaningful overlap. But the priority remains: who’s doing the best deals? Manager diversification, vintage diversification and strategy diversification drive decisions more than an overlap output,” he said.
Non-traded BDCs, a big part of the push for retail investors, have created the conditions for large deals with more lenders and more portfolio overlap. Those funds have changed the game, as they must put capital out the door to create yield that drives investor returns, Callan’s Griffin said.
“There’s a need for managers to stay invested–they can’t just hold cash,” he said. “The need to stay invested and to originate creates an environment conducive to large private transactions with multiple large lenders.”
Wilshire’s Gnall agreed.
“BDCs increase the amount of strategy assets deployed, alongside a traditional closed-end vehicle. Because of that, it naturally pushes a lot of these [direct lending] strategies toward the larger end of the private credit spectrum. So I’d say that contributes to the trend in overlap,” he said.
Andrew Hedlund
andrew.hedlund@levfininsights.com
+1 480 313 1334
Tom Davidson
thomas.davidson@levfininsights.com
+1 646 943 6231